
Share this
by Opendock Team on 26 February, 2026
Key Takeaways
- The Opendock Index registered 94.5 in January, down 10.9% from last year.
- Furniture and appliance volumes dropped 9.6% month-on-month in January.
- Food, beverage, and packaging sectors posted gains above last year's levels.
- 3PL warehouses jumped 12.5% monthly but stayed 18.7% below last January.
As the new year gets underway, the latest data from the Opendock Index offers a revealing snapshot of where warehouse activity stands across key industry sectors. Updated with January 2026 figures, the index, which uses a baseline of 100 to represent "normal" activity levels, paints a picture of a supply chain still working through the aftereffects of 2025's shifting demand patterns. While some sectors are showing encouraging signs of recovery, the broader trend points to a cautious, uneven start to the year.

Furniture, Appliances and Equipment: A Sector Under Pressure
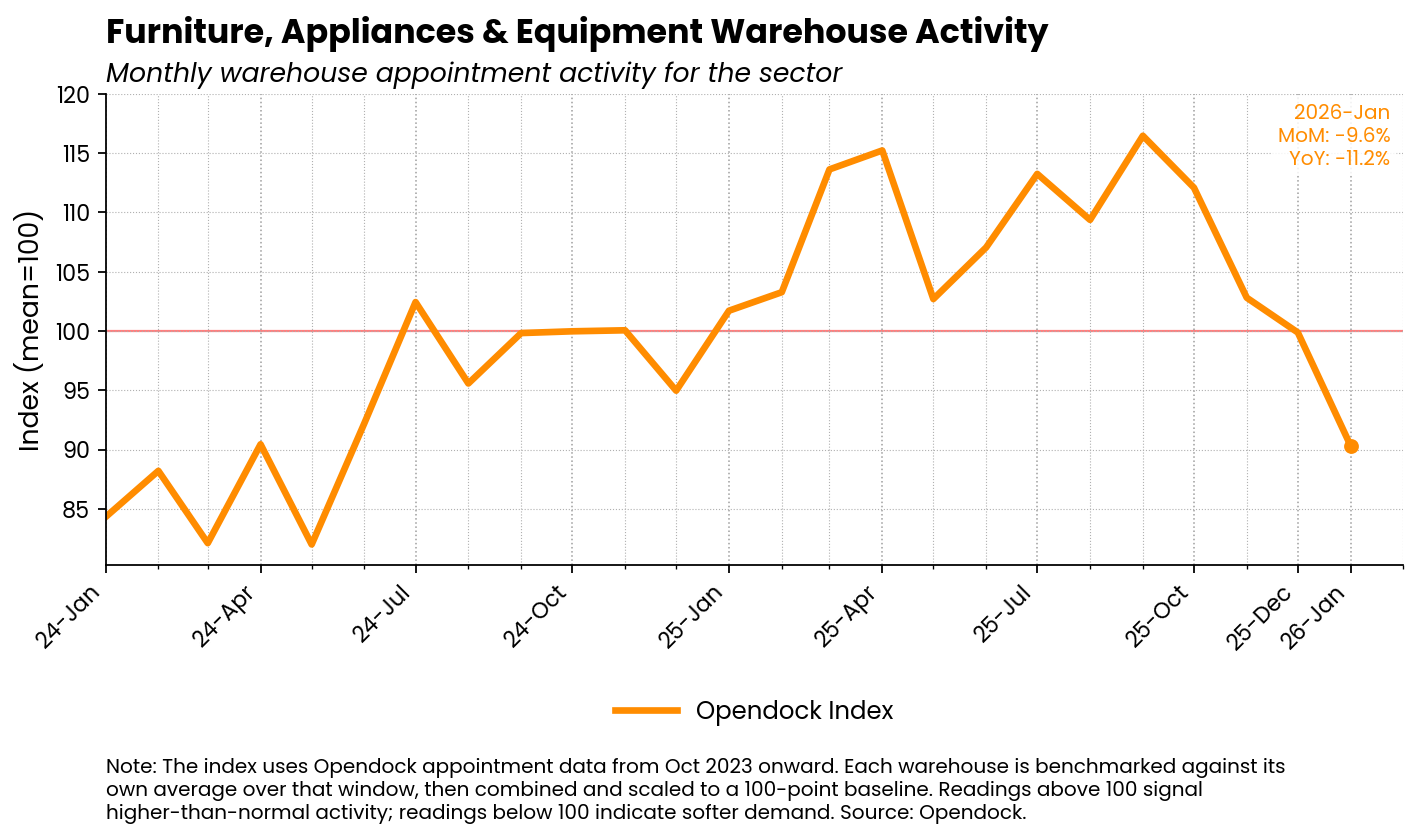
The news was notably grim for the furniture, appliances, and equipment sector. Warehouse appointment volumes dropped 9.6% month-on-month in January, pushing the index to 11.2% below last year's levels. This looks like more than just the typical post-holiday lull. The leading explanation is that distributors pulled shipments forward earlier in 2025 and are now rightsizing inventory as demand for big-ticket items remains soft. Until consumer appetite for major purchases picks back up, this sector is likely to stay under pressure.
Food, Beverage and OTC: A Bright Spot
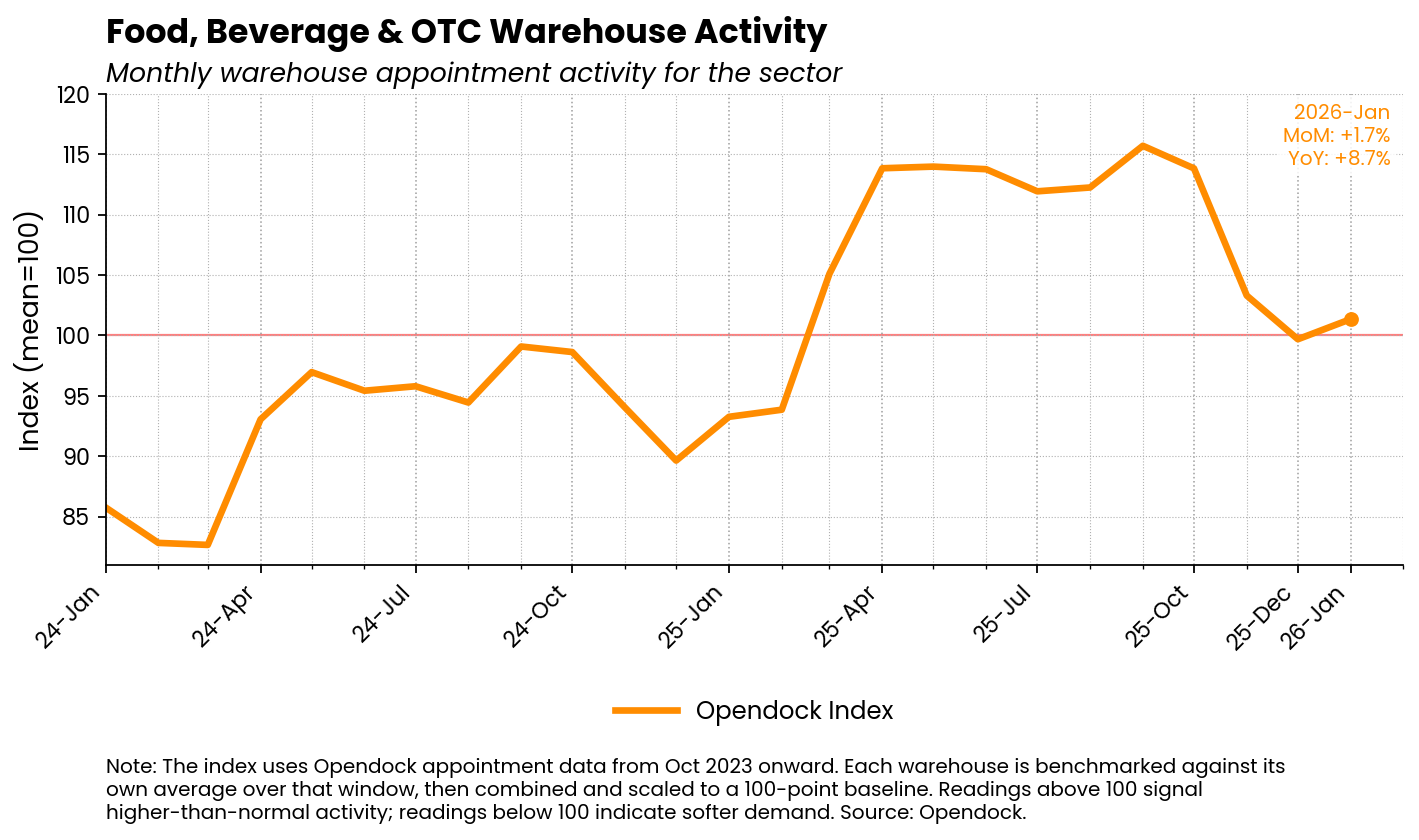
In contrast, the food and consumer staples sector offered a more optimistic signal. Warehouse appointments rose 1.7% month-on-month and came in 8.7% above January of last year, nudging the index back above the 100 baseline. Demand for everyday essentials proved resilient, and for food logistics operations, this sector's performance stands out as one of the more encouraging data points in an otherwise subdued report.
Packaging: Bouncing Back from a Seasonal Dip
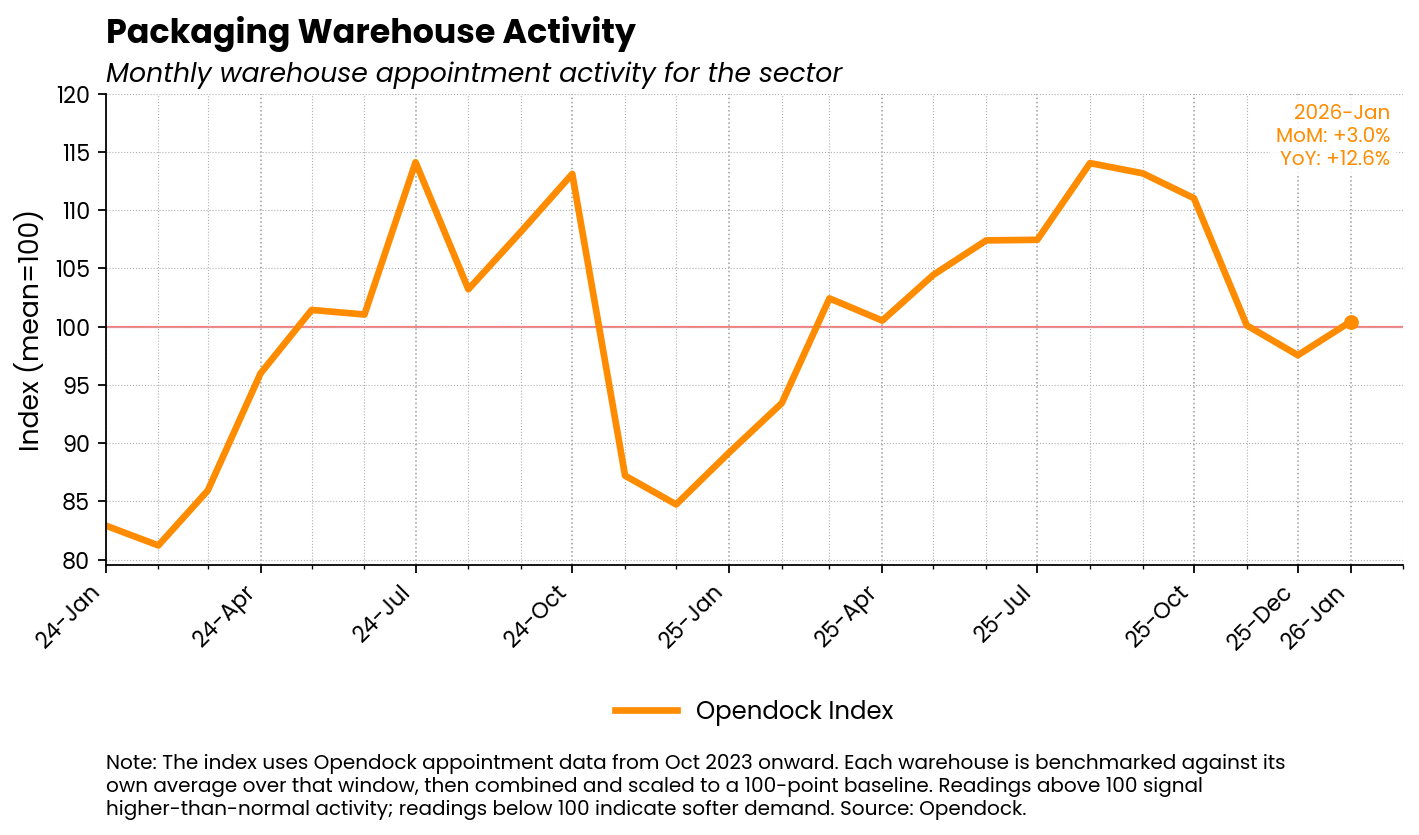
Packaging activity followed a similar upward trajectory, rebounding after December's seasonal slowdown. Appointment volumes grew 3.0% month-on-month and were 12.6% higher than the same period last year, pushing the index back above the 100 line. The recovery suggests that demand for paper and packaging is holding up well and tracking broader consumer goods activity fairly closely.

Why Are 3PL Warehouses Still Below Normal?
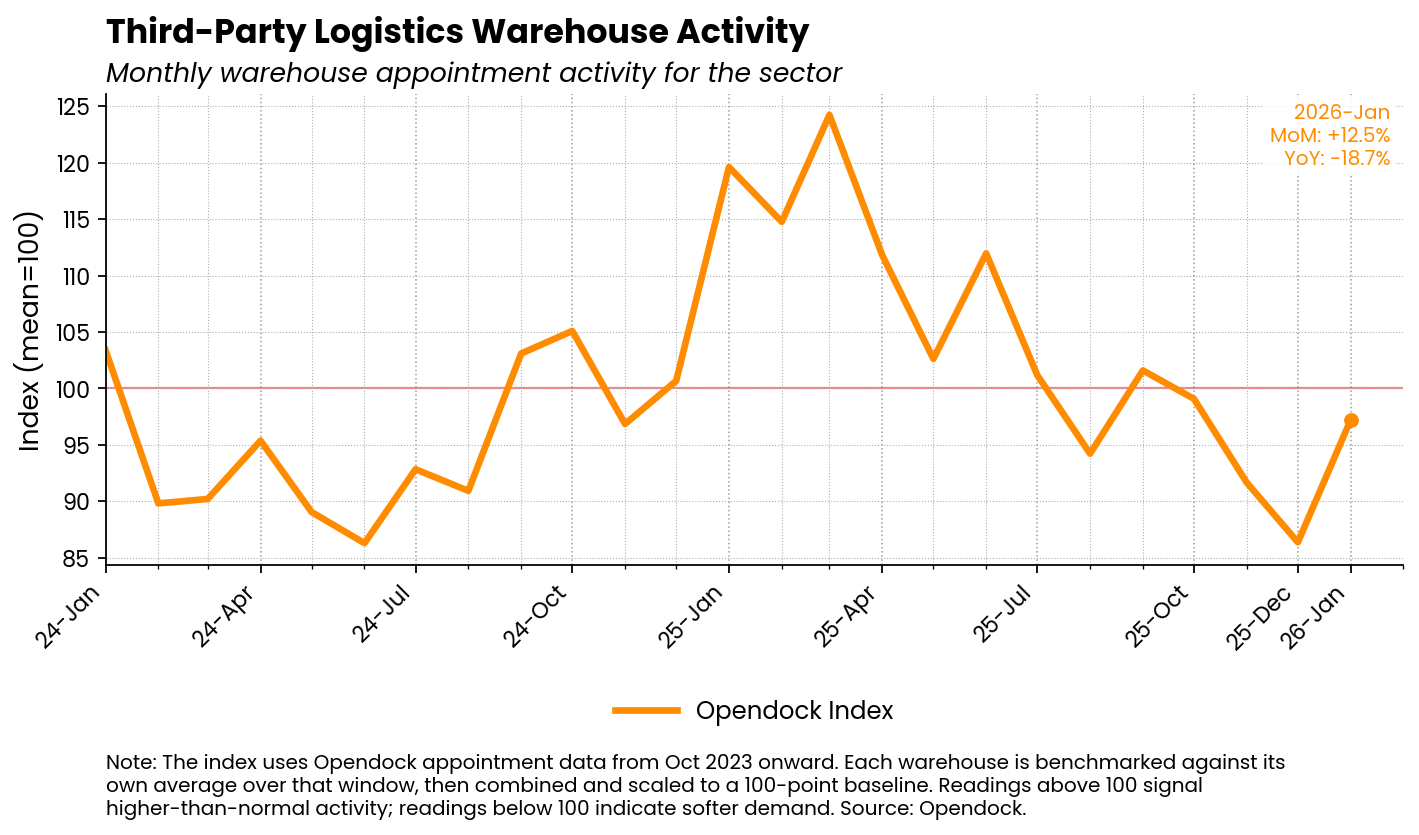
3PL warehouses are still below normal because January's 12.5% month-on-month jump came off a weak December, leaving the index 18.7% lower than last January. That gap is a reminder that the earlier pull-forward of peak logistics activity into summer and autumn 2025 continues to distort year-over-year comparisons for 3PL warehouses. The rebound looks more like a bounce off a low floor than the beginning of a sustained acceleration.
How Did Warehouse Activity Start 2026 Overall?
Warehouse activity started 2026 softly, with the all-industries Opendock Index at 94.5 in January, down 0.9% from December and 10.9% below last year. Overall warehouse appointment volumes remain below what would be considered normal, and there's little evidence of a meaningful post-holiday rebound taking shape. The aggregate picture reflects a supply chain that is still digesting the ripple effects of last year's demand timing shifts.
A slower stretch is also a good time to measure what scheduling inefficiency costs, which the Opendock ROI calculator can help estimate.
Here is how each sector moved in January:
- Furniture, appliances, and equipment: down 9.6% month-on-month and 11.2% below last year.
- Food, beverage, and OTC: up 1.7% month-on-month and 8.7% above last year.
- Packaging: up 3.0% month-on-month and 12.6% above last year.
- 3PL: up 12.5% month-on-month but 18.7% below last year.
- All industries: down 0.9% month-on-month and 10.9% below last year.
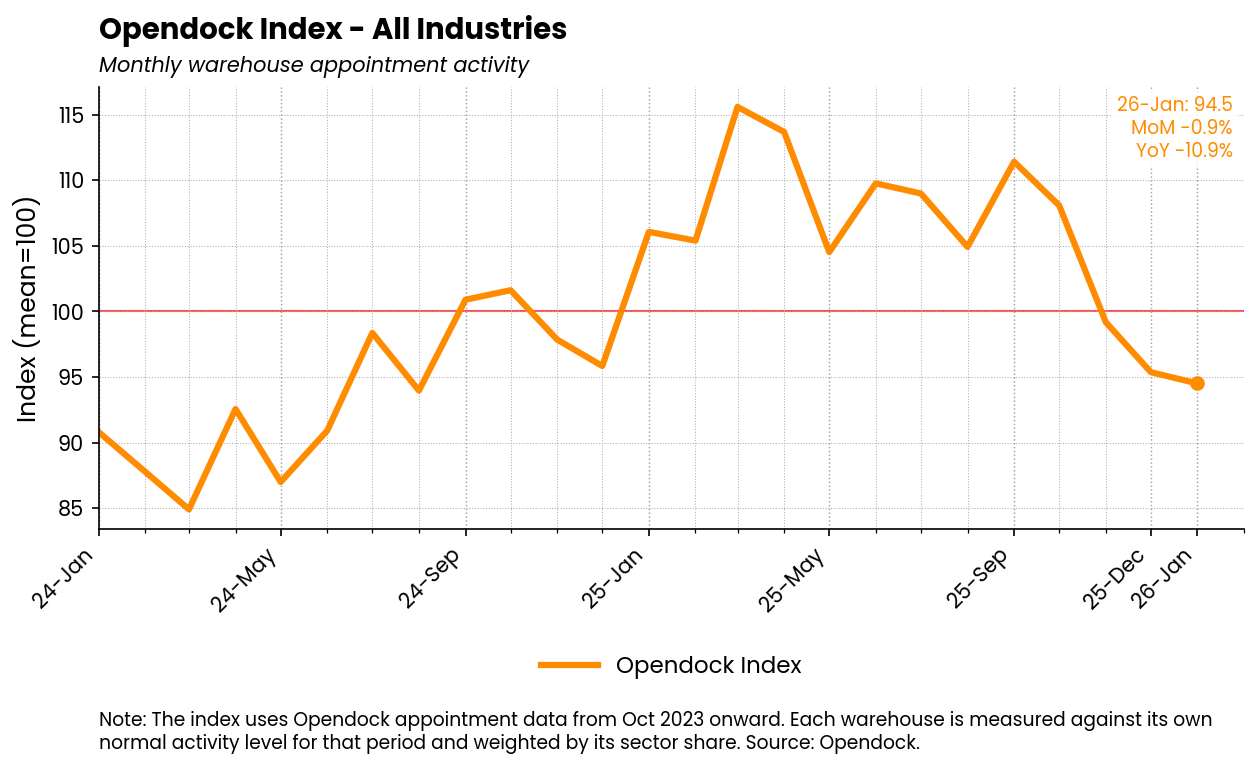
What Does January's Data Mean for the Rest of 2026?
January's data makes clear that 2026 is beginning on uneven footing. Sectors tied to everyday consumer needs, like food, beverages, and packaging, are holding their own, while interest-rate-sensitive categories like furniture and appliances continue to struggle. For 3PL providers, the road back to year-over-year growth will likely be a gradual one.
As inventory normalization continues and demand patterns stabilize, the coming months will be telling. When volumes swing sector by sector, strong dock management helps facilities match labor and dock capacity to the freight that actually shows up.
For now, the Opendock Index suggests that patience and close attention to sector-level signals will be key for logistics and supply chain professionals navigating the months ahead.

Frequently Asked Questions
What Is the Opendock Index?
The Opendock Index is a monthly snapshot of warehouse appointment activity across key sectors, using a baseline of 100 to represent normal activity levels. It is built from warehouse appointment volume data rather than surveys or estimates.
Why Did Warehouse Activity Start 2026 So Soft?
The Opendock Index registered 94.5 in January, down 10.9% from last year, largely because distributors pulled shipments forward earlier in 2025. That earlier pull-forward is still distorting year-over-year comparisons across several sectors.
Which Sectors Performed Best in January 2026?
Food, beverage, and OTC, along with packaging, were the strongest sectors, both posting gains above their year-ago levels. Furniture, appliances, and equipment were the weakest, dropping 9.6% month-on-month.